Lower Nyabarongo (NNYL)
The lower Nyabarongo catchment starts at the confluence of the Upper Nyabarongo River with the Mukungwa, belongs to the Nile basin, is entirely located in Rwanda and is a downstream catchment in the sense that there is flow entering the catchment from upstream.
It is in this catchment that the Nyabarongo River changes from a mountain stream with a significant gradient to a broad valley (from one to several kilometers wide) that is flooded annually over its entire width from the slow meandering river that runs its lingering course all the way to the Rusumo falls which are the very reason for the formation of the floodplain.
The lower Nyabarongo catchment comprises numerous smaller catchments as well as three significant tributaries in the form of the Base (in the North West), the Mambu (in the West), and the Nyabugogo River (in the East). Covering almost half of the entire catchment area, the Nyabugogo catchment is particularly large.
The downstream limit of the catchment is defined at the confluence with the Akanyaru River for a length of some 70 km over which a significant catchment area is drained.
With a clearly defined upstream inflow location, a proper catchment area and an outflow location, the Lower Nyabarongo catchment is properly demarcated. A subdivision of the catchment or a downstream extension would compromise the monitoring of the catchment outflow and thus one of the prerequisites for proper water management.
Some surface areas that are particularly interesting to know in the catchment are given here below :
- Total area of the NNYL catchment : 3,304 km² (Completely included in Rwanda)
- Total area of the Nyabugogo subcatchment (NNYL_1) : 1,540 km²
- Total upstream area of NNYU : 3,348 km²
- Total upstream area of NMUK : 1,949 km²
- Total drainage area (NNYU+NMUK+NNYL) : 8,601 km²
The catchment area is essentially covered by the following ten districts: Gakenke, Muhanga, Rulindo, Kamonyi, Gicumbi, Gasabo, Nyarugenge, Gatsibo, Rwamagana and Kayonza. Some small areas of the catchment are located in the districts of Kicukiro and Burera.
A further subdivision of the level 1 catchment of 3,304 km² has been suggested as follows for the creation of two level 2 sub-catchments :
- Muhazi Nyabugogo (NNYL_1). As already mentioned, the Nyabugogo river is a major tributary with both flooding and pollution problems originating in the Kigali area just upstream of the confluence with the Nyabarongo. Lake Muhazi drains an important inflow area with a potential for flow regulation to control flooding in the Kigali area (area of 1,540 km²) and the possibility to operate it as a storage reservoir for carrying over surface water from the wet season to the dry season.
- Nyabarongo valley (NNYL_2). The main valley of the Nyabarongo with numerous level 3 catchments contributing to the flow; at this lower level the Nyabarongo is meandering through a relatively wide river valley hence features substantial groundwater resources (area of 1,764 km² in Rwanda).
The principal water resources in the catchment are as follows :
- the average annual rainfall is slightly below 1,200 mm/annum which equates to some 3,935 hm³/annum from the total land surface area of 3,304 km².
- the combined average annual surface flow generated within the catchment stands at 28 m³/s or some 899 hm³/annum.
- the groundwater annual recharge / safe yield is about 545 hm³/annum. With a total storage estimated at 8,673 hm³, the mean residence time of groundwater in the catchment is some 16 years.
Land characteristics in the catchment are summarily presented as follows :
- the lithology is defined by the predominance of shale material in the western part of the catchment, alteration of schist and quartzite in the center and east and some significant intrusions of granite and pegmatite. All of the valley bottoms throughout the catchment contain alluvial material except for the flood plain of the Nyabarongo which is classified as a peat soil. In terms of groundwater productivity, shale and schist aquifer tent to have low permeability and are therefore not very interesting for groundwater exploitation. Granite and pegmatite can be exploited for low yields as they are generally deeply weathered to provide adequate storage capacity. Quartzite and alluvial material are generally interesting for groundwater exploitation but require proper investigation.
- the soil classes are predominantly the 'nitosol - acricol -alisol - lixisol' class found throughout the catchment area complemented with extended areas with ferralsols in the eastern tip around lake Muhazi and some areas in the West. A somewhat extended domain of the cambisol class is found in the most western side of the catchment with smaller areas spread throughout. All of these soil classes have significant infiltration rates. Low infiltration rates are found throughout the catchment in valley bottoms featuring 'mineral soils conditioned by flat topography' and 'clay soils with low infiltration rates' soil classes. These latter, lower infiltration rate classes are quite prevalent in the central part of the catchment.
- the land cover of the catchment is dominated by rainfed agriculture completed with 'irrigated/agricultural wetland', numerous small plots of forest plantation (especially in the center and east), and similarly small areas of 'natural open land'. Due to the city of Kigali, the built-up area is rather significant in this catchment. There is a single small area of natural forest in the west.
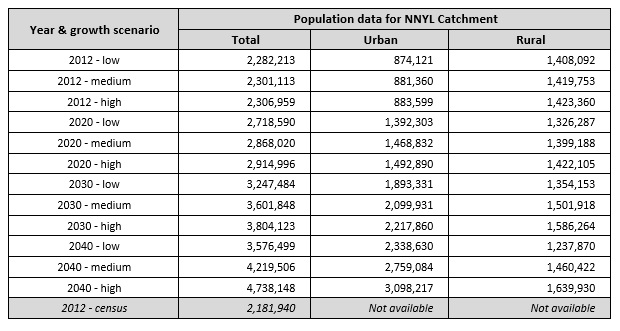
As of 2012, the total population in the catchment was assessed (2012 population census) at 2,182 million dispersed throughout the catchment with highest density in the city of Kigali and around the urban centers of Gicumbi, Muhanga and Rwamagana. Catchment wide population data are given in the table below. The provisional 2012 census data per sector have been converted to population per catchment. The 2012 census result for the NNYL catchment stands at 2,181,940 population which is 4.39 % below the low growth scenario projection. Over the period 2002 - 2012 this equates to an annual difference of 4.31 ‰ (overestimation of the projection data).
As regards the development of land resources, and as already indicated above, the bulk of the land is used for rainfed agriculture and the catchment contains the larger part of Kigali city. Irrigation and agricultural production in wetland is widespread and forest plantations are present in numerous smaller spots throughout the catchment yet with some dominance in the center and western parts of the catchment.
Bench and radical terraces are implemented throughout the catchment but the surface area thus protected from erosion remains limited. Cheaper erosion protection works like trenches, contour plantations, etc. are widespread. Borders of water courses are protected by law from exploitation for agricultural use. The urban area of Kigali is sprawling and some areas are very crowded with dramatically insufficient water retention leading to flashfloods even from rather common rainfall events. Other urban areas (Muhanga, Gicumbi, Rwamagana, and other towns) are limited in size and not very crowded.